



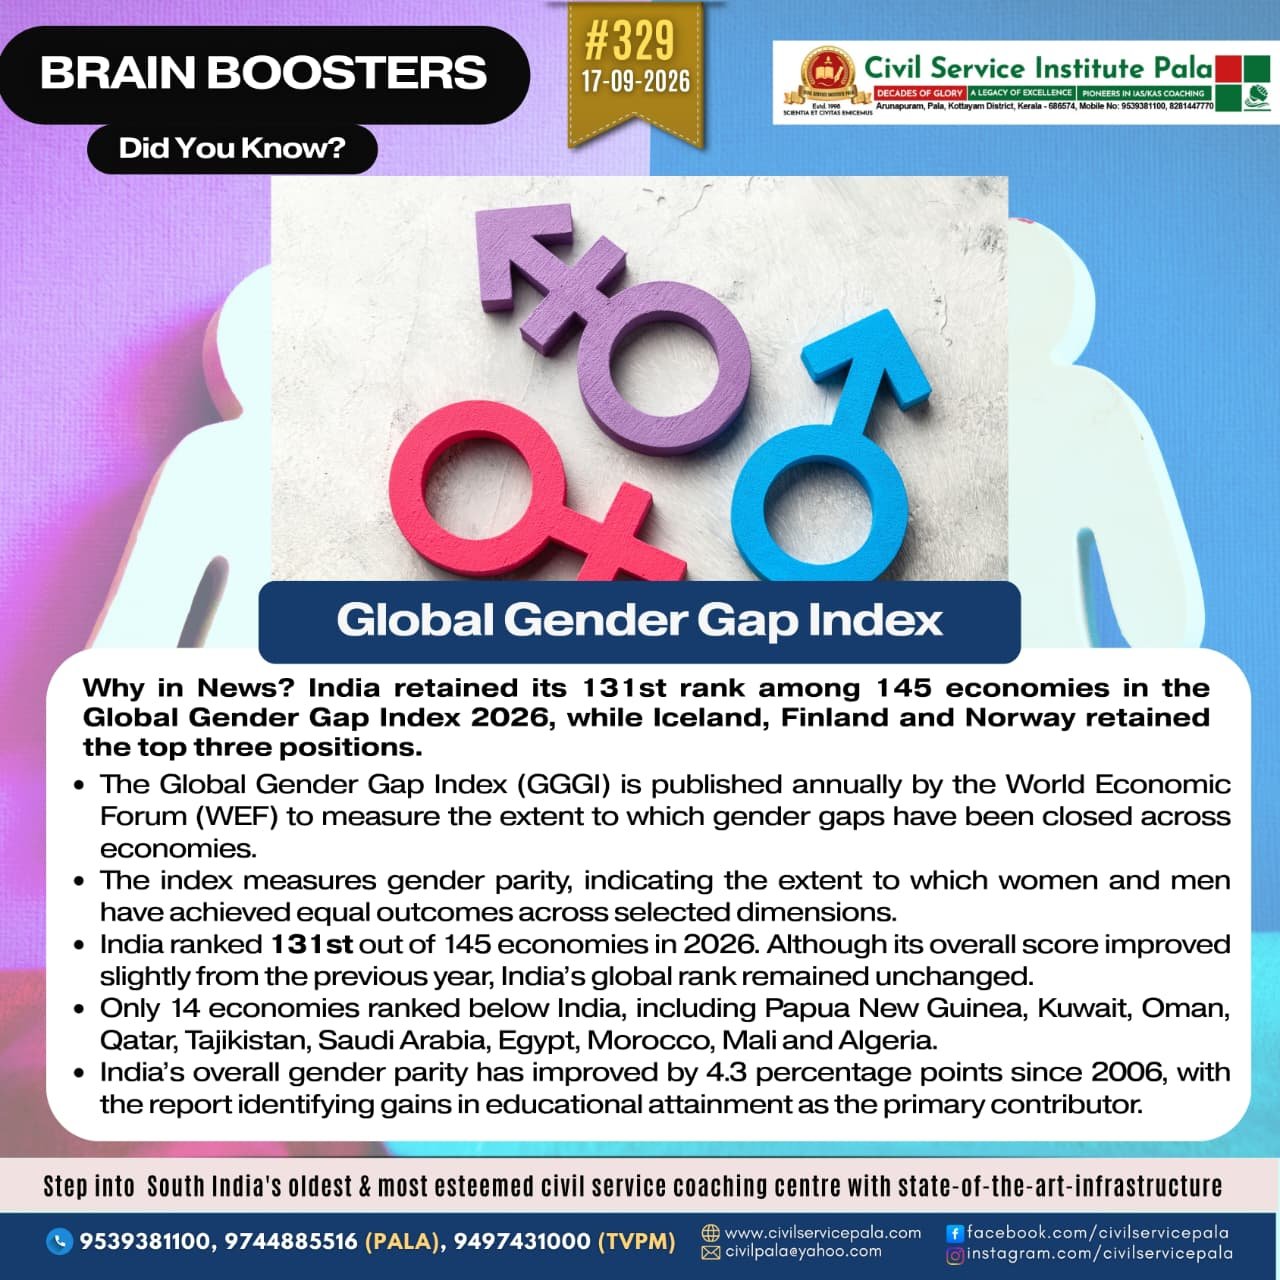
Global Gender Gap Index 2026
Global Gender Gap Index 2026
1. Why in News?
India retained its 131st rank among 145 economies in the Global Gender Gap Index 2026, while Iceland, Finland and Norway retained the top three positions.
2. What is the Global Gender Gap Index?
• The Global Gender Gap Index (GGGI) is published annually by the World Economic Forum (WEF) to measure the extent to which gender gaps have been closed across countries.
• The index measures gender parity, meaning the extent to which women and men have achieved equal outcomes across selected dimensions.
• It measures the gap between women and men rather than the overall level of development or resources available in a country. Therefore, a country's income level alone does not determine its position.
• Scores are expressed on a 0–1 scale, where a higher score represents a greater proportion of the gender gap that has been closed.
• The score can also be expressed as a percentage, with 100% representing full parity.
3. The Four Dimensions of the Index
The index measures gender parity across four major dimensions:
1. Economic Participation and Opportunity : Women's participation and position in the economy
2. Educational Attainment : Gender gaps in access to and achievement in education
3. Health and Survival : Gender differences in health-related outcomes
4. Political Empowerment : Women's representation and participation in political decision-making
The four dimensions are important because gender equality is not limited to education or political representation. A country may perform strongly in one dimension while continuing to have significant gaps in another.
Global Picture: Progress, But Slow Progress
• In 2026, 69.2% of the global gender gap had been closed, an improvement of 0.4 percentage points over 2025.
• Among the 97 economies continuously covered since 2006, gender parity increased by 5.2 percentage points, reaching 69.4%, its highest level in the series.
• However, at the current rate of progress, global gender parity is estimated to remain about 120 years away.
• No economy achieved full gender parity in 2026. Iceland, with 93% of its gender gap closed, remained the only economy above the 90% mark.
• The four dimensions show a major imbalance. Health and Survival (96.2%) and Educational Attainment (96.9%) are closest to parity, while Economic Participation and Opportunity (61.7%) and particularly Political Empowerment (22.1%) have much larger gaps.
5. Global Leaders
The top three economies in 2026 were:
1. Iceland – 93%
2. Finland – 87.2%
3. Norway – 85.7%
Other economies in the top ten included Namibia, the United Kingdom, New Zealand, Sweden, Australia, Germany and Ireland.
• Namibia ranked fourth and was the highest-ranked economy in Sub-Saharan Africa.
• Australia entered the top ten for the first time, ranking eighth.
• Iceland, Finland, Norway and Sweden have appeared in the top ten in every edition since 2006.
India's Overall Position
• India ranked 131st out of 145 economies in 2026, with 64.5% of its overall gender gap closed.
• India's score improved slightly over the previous year, but its global rank remained unchanged.
• Only 14 economies ranked below India, including Papua New Guinea, Kuwait, Oman, Qatar, Tajikistan, Saudi Arabia, Egypt, Morocco, Mali and Algeria.
• Chad ranked last, with Iran and Pakistan occupying the other two positions in the bottom three.
• India's overall gender parity has improved by 4.3 percentage points since 2006, with the report identifying gains in educational attainment as the primary contributor.
India's Economic Participation Gap Remains Significant
• India's Economic Participation and Opportunity score was 41.2%, only 0.5 percentage points higher than the previous edition.
• However, this remained 3.5 percentage points below India's best result in 2013, showing that improvement has not been continuous.
• Parity among professional and technical workers almost doubled from 26.6% in 2006 to 49.9% in 2026.
• Representation among legislators, senior officials and managers increased by 10 percentage points since 2006, but remained low at 13.1%.
• Labour-force participation parity stood at 44.1% in 2026, showing that substantial differences remain in women's participation in the workforce.
India Performs Much Better in Education
• India's Educational Attainment score was 96.6%, placing this dimension much closer to gender parity than economic participation.
• However, the score declined by 0.5 percentage points from the previous year.
• This creates an important contrast in India's gender-gap profile: educational parity is relatively high, while economic participation remains substantially lower.
• The broader implication is that improvements in women's access to education do not automatically translate into equal participation and advancement in the labour market.
Health and Survival
• India's Health and Survival parity score improved to 95.6% in 2026.
• However, India's sex ratio at birth remained nearly one percentage point below its 2006 level, despite an upward trajectory since 2017.
• This shows that high aggregate health parity does not mean that every health-related indicator has reached or maintained full parity.
Political Empowerment: India's Highest-Ranked Subindex
• Political Empowerment was India's highest-ranked subindex, with 24.5% of the gender gap closed and India ranking 67th globally on this dimension.
• India's head-of-state indicator started at a relatively high 42.9% in 2006 and rose to 72.3% during the first decade, reflecting women's leadership within the indicator's rolling 50-year reference period.
• However, the score subsequently declined and stood at 40.7% in 2026, showing that earlier gains have not been sustained at the same level.
• In Parliament, India had closed 16.1% of the gender gap in 2026, representing an overall gain of 7 percentage points since 2006.
• At the ministerial level, India's parity score increased from 3.5% in 2006 to 5.9% in 2026, an overall gain of 2.4 percentage points.
• However, the ministerial score remained substantially below India's 30% peak in 2019.
The Global Political Empowerment Problem
• Political Empowerment has recorded the largest improvement among the four dimensions since 2006, but its progress has also shown signs of reversal.
• Globally, the Political Empowerment parity score among the continuously tracked economies increased by about 8 percentage points, from 14.4% to 22.4%.
• At the present rate of progress, full political parity is estimated to be 194 years away, much slower than the estimated timelines for the other dimensions.
• The share of economies led by a woman peaked in 2022 but subsequently fell back to 2016 levels.
• Women have increasingly entered senior executive and cabinet positions, but remain underrepresented in positions carrying the greatest economic and political influence.
Gender Gap in the Emerging AI Economy
• The report also highlights a new dimension of gender inequality in artificial intelligence.
• Women accounted for fewer than one in five AI engineers and remained underrepresented across levels of AI firms.
• This matters because technological sectors increasingly influence future employment, innovation and economic power. Existing gender gaps can therefore be reproduced in emerging industries if participation remains unequal.
Regional and Income-Level Pattern
• Southern Asia was the lowest-scoring region in Economic Participation and Opportunity, indicating particularly large economic gender gaps in the region.
• Average gender parity varied across income groups, with higher-income economies averaging 74.5%, upper-middle-income economies 70.3%, lower-middle-income economies 66.3%, and low-income economies 65.8%.
• However, the report notes that these groups overlap considerably. Some lower-income economies have performed better than many higher-income economies.
• This suggests that income alone does not determine the speed or extent of progress towards gender parity.
What Does the 20-Year Trend Show?
• The 2026 edition marks the 20th edition of the index and provides a long-term comparison using a constant sample of 97 economies included in every edition since 2006.
• Progress was faster during the first decade of the index and slowed during the second decade.
• The proportion of economies recording gains peaked in 2019 at 76.3%, before the pandemic produced widespread setbacks.
• Since 2024, more than half of the continuously tracked economies have regained momentum.
• Over the 20-year period, the largest improvement globally occurred in Political Empowerment, followed by Educational Attainment and Economic Participation and Opportunity, while Health and Survival remained broadly unchanged.
